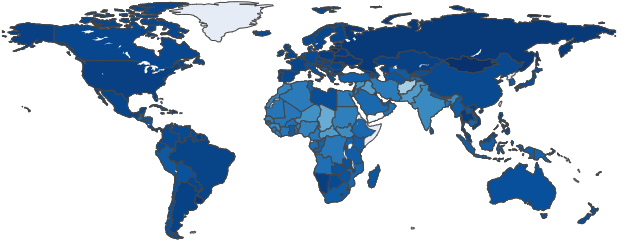
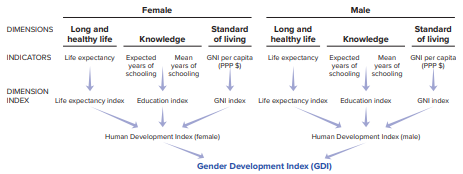
The Gender Development Index (GDI) is one of many indices created and compiled by large international organizations like the United Nations Development Programme (UNDP). The GDI is a yearly score given to countries and builds on the Human Development Index by looking at that in terms of the genders. For each gender, a score looking across key dimensions of human development, such as health, education, and economic empowerment, will be devised. The education factor uses expected years of schooling and access to schooling. The economic dimension looks at access and opportunities to jobs as well as estimated income. The GDI is then created by dividing the women's score by the men's score. GDI values close to one, therefore, represent a country with equality between the genders. The key columns in this dataset are the country's name, ISO country code, and yearly GDI from 1960-2021.
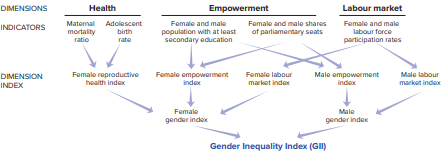
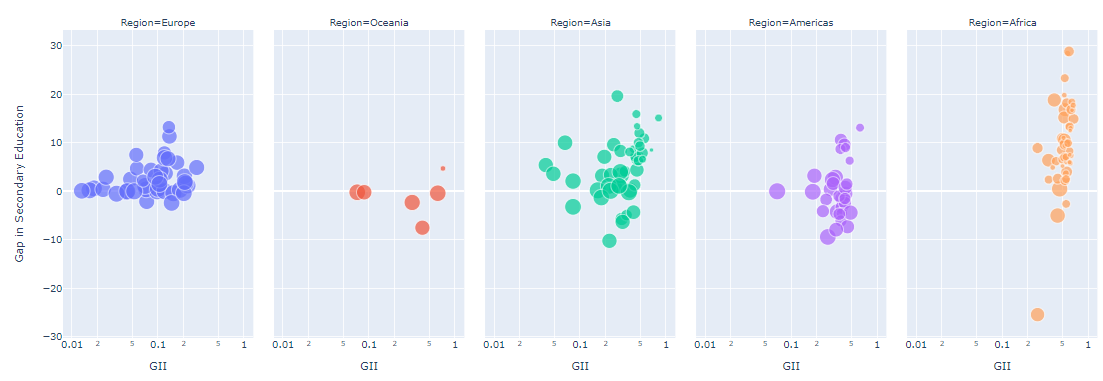
The definition by the United Nations Development Program (UNDP): “GII is a composite metric of gender inequality using three dimensions: reproductive health, empowerment and the labor market. A low GII value indicates low inequality between women and men, and vice-versa.”
Anyone who is interested in human development, gender inequality, and developmental studies may use this project. The original dataset presented by UNDP is super meaningful and useful, but people may not be clear about what exactly are included in the data and wonder if they need to take a deeper look at the details of the megadata offered by UNDP. Therefore, our project saves time for anyone who is interested in the general topic of gender inequality or human development and wants to study deeper in some available datasets online. Our visualizations offer general conclusions of different indicators of the gender inequality index, as well as meaningful comparisons between the gender development index and GDP, as well as government types that provide users with a trend over the years. Our project is not to replace the deep understanding of the field of study in human development and gender inequality, but a brief summary of general insights from the authoritative United Nations dataset and offers some possible directions of further research and studies of the fields to those who are interested in the topics.
The data sources on the gender inequality index and gender development index come from the United Nations Development Program. The GDP data comes from World Bank National Accounts data. Initially working on the CPIA gender equality rating from the United Nations, we found so many unavailable entries that hindered us from transforming data to meaningful conclusions. Therefore, we turned to look at other data related to gender inequality from the United Nations, which led us to the UNDP website. The data offered there were chosen for the following reasons: first, the data is relatively complete, meaning the unavailable parts are much fewer than other data; second, it has multiple dimensions; it not only offers overall levels of the GII or GDI values but also included information like specific indicators contributing to the overall levels that can potentially bring more analysis or changes over the years. Third, the changes in GDI values over the years allow us to make a comparison with GDP, which can bring extra insights.
We chose this topic because we believe that a brief analysis of the world situation on gender inequality issue can be meaningful as although we tend to trust ourselves that we have a sense of the general gender inequality situation of different parts of the world, we, the ordinary people, have little information on what are the exact situations of different aspects of gender inequality of other countries, and how have situations have changed over the time.
From this project, we familiarized ourselves with the specific steps of data selection, data processing, and transforming data into meaningful information. We understood what types of data are potentially meaningful and workable for presenting information. We knew the required steps for testing the data and cleaning the data, especially which types of visualizations can be potentially used based on the types of data. Throughout the process, we not only practiced the known methods of transforming data into information but also acquired the mindset of selecting the based ways to present data, which turned out to lead us to several new techniques and methods in coding.
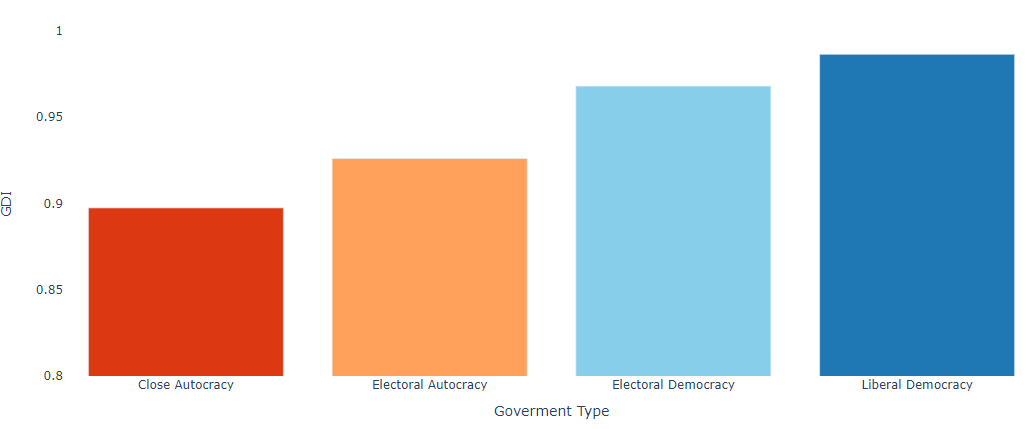
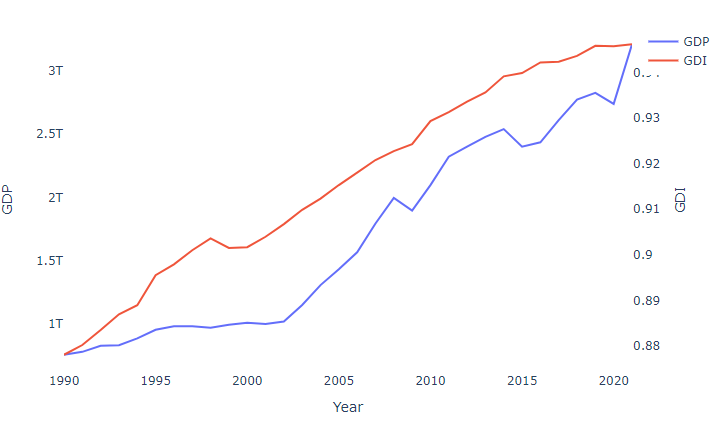
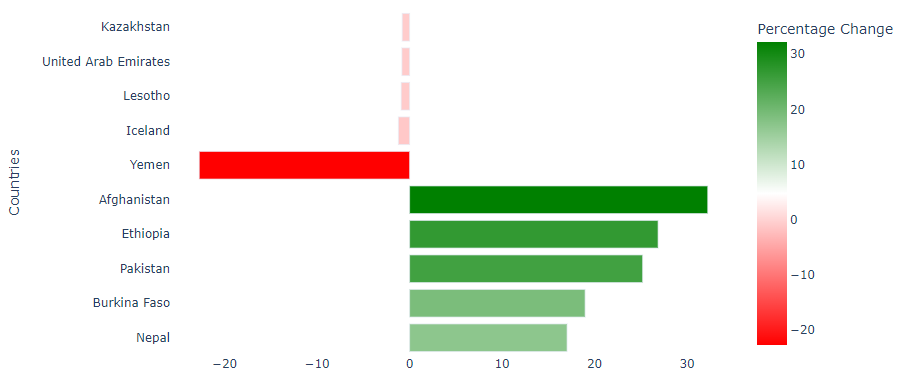
The GDI, like the GII, has a large fluctuation between countries and time frames. It is interesting to investigate the various factors that can contribute to GDI. Looking at the increase in the GDP and GDI over time shows a decent positive relationship. As countries get richer or more developed, they tend to provide a more equitable society between the genders. The type of government that a country employee also shows to be an influence in the GDI. Counties that are Liberal Democracies have much better gender equality than Close Autocracy. Likewise, looking at GDI over time can show countries that are under duress. For example, Yemen saw a significant decrease in its GDI score most likely resulting from the outbreak of a Civil War.
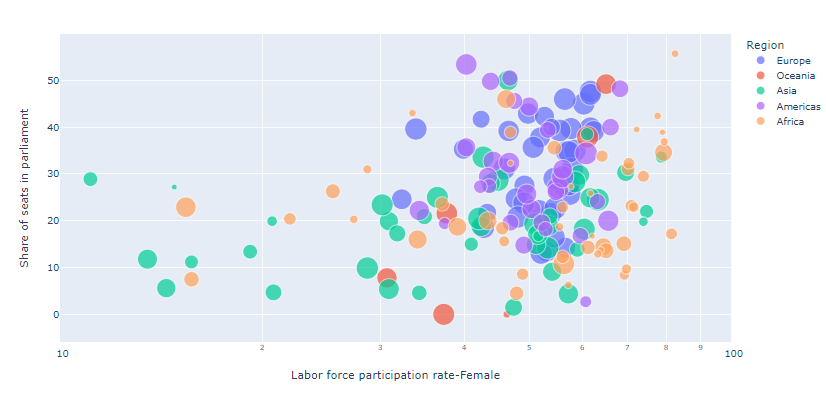
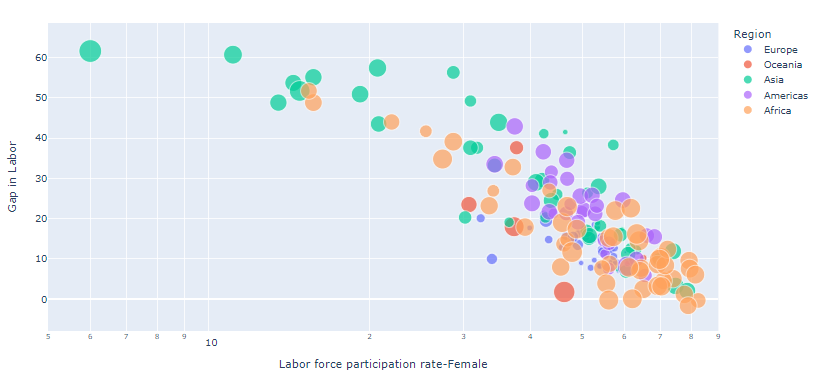
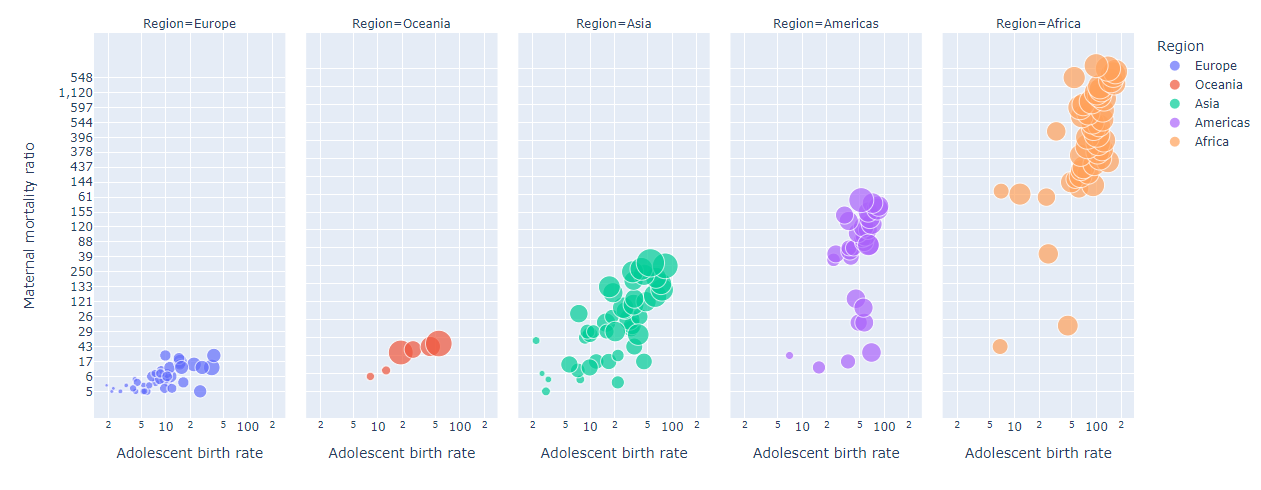
To conclude, the GII itself, as well as its indicators, have large variations among countries of the world as, in general, every indicator shows a general positive correlation with the GII values. While all indicators do convey meaningful messages in terms of the level of gender inequality in the country, the visualizations offered in this project still tell us that different indicators are different in terms of how reflective they are in different regions. For some indicators, the variations in the region can be different than the GII variations in that region, suggesting the potential for further study in that aspect of the region. Besides, the correlations among the indicators are also shown in the visualizations with insights that also show possibilities for further study in related policies.